Joomla is a great content management system and once you get to know about the structure of components, modules and plugins you can begin to create your own custom extensions. However, online documentation is pretty sparse when it comes to this part - the most in-depth documentation usually only consists of how to create a 'Hello World' extension.
As a newcomer to the world of Joomla I found this lack of tutorials quite frustrating so I've decided to write my own. The following instructions explain how to create a module from scratch that includes parameters, a third party library and a Google map chart. Once finished we will have a module that displays visitor information on a map of the world using data grabbed from Google Analytics. Hopefully this will shed some light on the topic for some of you.
To start the process you are going to need to have Joomla installed either on your local machine or on a web server. To find out how to do this please follow these instructions or some similar ones.
You will also need to have Google Analytics set up on your site in order to be able to pull data from the Analytics API.
In your FTP client or on your local machine navigate to your site's main directory. From here go to the directory administrator/modules. You will see a list of directories whose titles begin with "mod_". Each one of these folders contains the files for an individual module.
Somewhere on your local machine create a new directory called "mod_analytics".
Open the mod_analytics directory and create two files - 'mod_analytics.xml' and 'mod_analytics.php'. If you're wondering how to do this, one easy way is to right click, create a new "Text Document" and change the extension from .txt to .php or .xml. Create another directory called 'tmpl'.

This xml file is the installation file for the module and it lets Joomla know that the module exists. It contains details of the module's version number, creation date, author, files, folders and parameters. We are going to create a module for the administrator interface of Joomla. For this reason we enter "client='administrator'" in the install type line. Open your empty xml and paste the following:
{codecitation class="brush: xml; gutter: false;" width="74.923em"}
<?xml version="1.0" encoding="utf-8"?>
<install type="module" client="administrator" version="1.5.0">
<name>Analytics</name>
<author>Your name or your company name</author>
<creationDate>May 2010</creationDate>
<copyright>Copyright (C) 2005 - 2010 Open Source Matters. All rights reserved.</copyright>
<license>http://www.gnu.org/licenses/gpl-2.0.html GNU/GPL</license>
<authorEmail>your email</authorEmail>
<authorUrl>freakedout</authorUrl>
<version>1.0</version>
<description>Allows you to display a Google Analytics visitor map in your admin interface</description>
<files>
<filename module="mod_analytics">mod_analytics.php</filename>
<folder module="mod_analytics">tmpl</folder>
</files>
</install>
{/codecitation}
Open the other file you created - mod_analytics.php. This is the next file that Joomla reads after the xml file and is the "entry" into the module. Paste the following into this file.
{codecitation class="brush:php; gutter:false;" width="74.923em"}
<?php
// no direct access
defined('_JEXEC') or die('Restricted access');
require(JModuleHelper::getLayoutPath('mod_analytics'));
{/codecitation}
The first line of code here, "defined...", is a standard line of code that ensures that the code is called through Joomla! instead of being accessed directly at ...administrator/modules/mod_analytics/mod_analytics.php.
The second line uses a built in function in Joomla called JModuleHelper that gets the path to the layout file for the module. We have not yet created this layout file. This is the next step.
Open the "tmpl" directory and create a file called "default.php" and paste the following.
{codecitation class="brush:php; gutter:false;" width="74.923em"}
<?php
// no direct access
defined( '_JEXEC' ) or die( 'Restricted access' );
echo '<table class="adminlist">This is some text that we are going to display</table>';
{/codecitation}
You have now finished setting up the basic structure for a module. Zip the folder mod_analytics.

Once you have zipped the folder you are ready to install your module. For details on how to install a module please see the following tutorial.
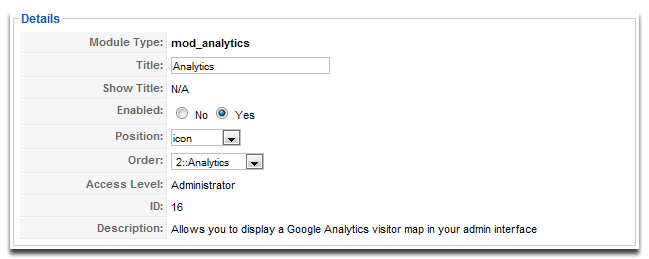
Now that the module is installed you will see it in the Administrator part of the Modules list. Open it up and set it to display in the "icon" position. This position is located on the "Control Panel" of the Joomla administrator interface.

Now go to the Control Panel and you should see something similar to the following screenshot.

We have a working module that displays some text. This is usually where most tutorials end but not this one!
Instead of displaying "This is some text that we are going to display" we want to display data from Google Analytics. In order to do this we are going to have to use a php library that connects to the Google Analytics API. We could create one at this point but a quick search on Google turns up the following result.
Download the Google analytics classes and unpack it somewhere on your local machine. Inside you will find two files, "googleanalytics.class.php" and "googleanalyticssample.php". Using your FTP client or on your local machine go to your site directory and navigate to ...administrator/modules/mod_analytics. Create a directory called "lib". Transfer the file "googleanalytics.class.php" to this directory.
This file contains a class of functions that communicate with the Google Analytics API and it was written by Doug Tan.
Now that we have our library we need to include it in our default layout. In your FTP client or on your local machine open the "tmpl" folder and then open the "default.php".
Delete this line from the code:
{codecitation class="brush:php; gutter:false;" width="74.923em"}
echo '<table class="adminlist">This is some text that we are going to display</table>';
{/codecitation}
And paste the following code into the file and save it.
{codecitation class="brush:php; gutter:false;" width="74.923em"}
//Define the path to the lib folder in our module directory.
$path = JPATH_ADMINISTRATOR.DS.'modules'.DS.'mod_analytics'.DS.'lib';
//Define the file name
$file = 'googleanalytics.class.php';
//Load the file so that the functions inside it can be used
require_once($path.DS.$file);
try {
// create an instance of the GoogleAnalytics class using your own Google {email} and {password}
$ga = new GoogleAnalytics('{email}','{password}');
// set the Google Analytics profile you want to access - format is 'ga:123456';
$ga->setProfile('{GA Profile ID}');
// set the date range we want for the report - format is YYYY-MM-DD
$ga->setDateRange('2009-04-01','2009-04-07');
// get the report for date and country showing pageviews and visits
$report = $ga->getReport(
array('dimensions'=>urlencode('ga:country'),
'metrics'=>urlencode('ga:pageviews,ga:visits'),
'sort'=>'-ga:pageviews'
)
);
//print out the $report array
print_r($report);
} catch (Exception $e) {
print 'Error: ' . $e->getMessage();
}
{/codecitation}
You will have to fill in your email, password and Google Analytics profile ID in order to get the code to work. The easiest way to get this is to go to the reporting section of analytics and copy it from the URL.
For example, if your URL looks like "https://www.google.com/analytics/reporting/?reset=1&id=12345678&pdr=20100405-20100505" then you would enter "ga:12345678" into the code as follows:
{codecitation class="brush:php; gutter:false;" width="74.923em"}
$ga->setProfile('ga:12345678');
{/codecitation}
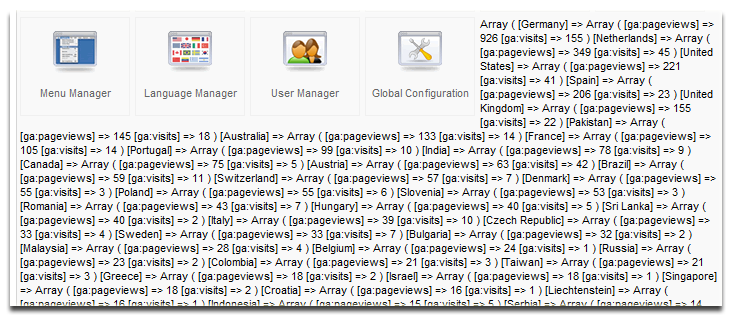
If you now refresh the control panel you should have something that looks like this:

This is a key/value array and doesn't exactly tell us very much in this format! We need to take this data and make it more presentable. In the default.php find this line:
{codecitation class="brush:php; gutter:false;" width="74.923em"}
print_r($report);
{/codecitation}
Replace it with the following code:
{codecitation class="brush:php; gutter:false;" width="74.923em"}
//Create a table and it's headers
echo '<table class="adminlist" style="width:556px"><th>Country</th><th>Visits</th><th>Page Views</th>';
//for each Country => Array( ga:pageviews => x, ga:visits => y )
foreach ($report as $key => $value ){
//Create a table row with 3 columns: country, visits and pageviews
$tablerow = '<tr><td>'.$key.'</td><td>'.$value['ga:visits'].'</td><td>'.$value['ga:pageviews'].'</td></tr>';
//Output the table row to the page
echo $tablerow;
//Create javascript for the Google map element
$map .= "data.setValue(".($i).",0,'".$key."');data.setValue(".($i).",1,".$value['ga:visits'].");";
}
//Close the table
echo '</table>';
{/codecitation}
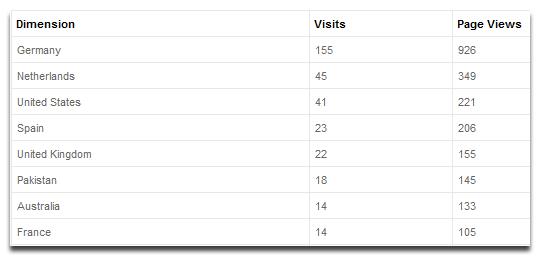
You should now have a table that looks something like this:

If you want to restrict the number of countries to the top 10 or some other number simply add a counter to the last bit of code as follows:
{codecitation class="brush:php; gutter:false;" width="74.923em"}
//Create a table and it's headers
echo '<table class="adminlist" style="width:556px"><th>Country</th><th>Visits</th><th>Page Views</th>';
//Set $i to zero
$i = 0;
//for each Country => Array( ga:pageviews => x, ga:visits => y )
foreach ($report as $key => $value ){
//If $i is less than 10
if($i<10) {
//Create a table row with 3 columns: country, visits and pageviews
$tablerow = '<tr><td>'.$key.'</td><td>'.$value['ga:visits'].'</td><td>'.$value['ga:pageviews'].'</td></tr>';
//Output the table row to the page
echo $tablerow;
}
//Create javascript for the Google map element
$map .= "data.setValue(".($i).",0,'".$key."');data.setValue(".($i).",1,".$value['ga:visits'].");";
//Add one to $i
$i++;
}
//Close the table
echo '</table>';
{/codecitation}
We now have our visits and page views per country displayed in a table. The $map variable is used to construct javascript that we will need to display our data on a map of the world. Google provides a handy charts API that allows us to do this. The documentation for the geo map chart that we are going to use can be found here.
Place the following code at the end of the default.php.
{codecitation class="brush:php; gutter:false;" width="74.923em"}
//Returns a reference to the global document object
$document = & JFactory::getDocument();
//Some Google javascript
$script="<script type='text/javascript' src='http://www.google.com/jsapi'></script>";
//Adds the script to the document
$document->addCustomTag($script);
//Counts the number of key value pairs in the report array
$countries = count($report);
//Script to construct the geo map
$script=" <script type='text/javascript'>
google.load('visualization', '1', {'packages': ['geomap']});
google.setOnLoadCallback(drawMap);
function drawMap() {
var data = new google.visualization.DataTable();
data.addRows(".$countries.");
data.addColumn('string', 'Country');
data.addColumn('number', 'Visits');
".$map."
var options = {};
options['dataMode'] = 'regions';
var container = document.getElementById('map_canvas');
var geomap = new google.visualization.GeoMap(container);
geomap.draw(data, options);
};
</script>
";
//add the script to the document so that the map is created
$document->addCustomTag($script);
//The div that the script adds the map to
echo "<div id='map_canvas'></div>";
{/codecitation}
This adds the javascript from Google that is required to use the geo map function and also some script that is used to create the map. This may seem confusing but this script was taken directly from here and the only bits that were changed were these parts.
{codecitation class="brush:javascript; gutter:false;" width="74.923em"}
data.addRows(6);
data.addColumn('string', 'City');
data.addColumn('number', 'Popularity');
data.setValue(0, 0, 'New York');
data.setValue(0, 1, 200);
...
{/codecitation}
We have switched 'City' for 'Country' and 'Popularity' for 'Visits' as these are the two variables we are displaying on the map. Our count() function gave us the number of rows for data.addRows(...) and the data.setValue(...) lines are constructed in the foreach loop from before and given the name $map.
When the page loads, the map is added to the div with the name 'map_canvas'. You should see this underneath your table of results.
We are nearly finished! Currently the username, password and profile ID are placed directly in the code. Obviously this is not ideal and a better way to obtain these details would be from the edit module view. To be able to store and retrieve data from this view we need to create some parameters for our module. This is done in the mod_analytics.xml file.
We will also add a line to include the 'lib' folder that we created earlier. This means that this folder will be installed with the module in the same way the "tmpl" folder was at the beginning.
So we replace this code in mod_analytics.xml:
{codecitation class="brush:xml; gutter:false;" width="74.923em"}
<files>
<filename module="mod_analytics">mod_analytics.php</filename>
<folder module="mod_analytics">tmpl</folder>
</files>
{/codecitation}
With
{codecitation class="brush:xml; gutter:false;" width="74.923em"}
<files>
<filename module="mod_analytics">mod_analytics.php</filename>
<folder module="mod_analytics">tmpl</folder>
<folder module="mod_analytics">lib</folder>
</files>
<params>
<param name="email" type="text" label="Email" description="Enter your Google Analytics email here" default="" />
<param name="password" type="password" label="Password" description="Enter your Google Anayltics password here" default="" />
<param name="profileid" type="text" label="Profile ID" desctiption="Enter the ID of the Google Analytics profile you wish to see stats for" default="" />
<param name="daterange" type="radio" default="1" label="Report Range" description = "Select a date range to run reports over" >
<option value="1">Last 7 Days</option>
<option value="2">Last 30 Days</option>
<option value="3">Last 365 Days</option>
</param>
</params>
{/codecitation}
Now when we go to edit our module we will see three text boxes that we can use to enter the analytics username, password and profile id. There will also be a radio button select list where the user can select to view reports over 7, 30 or 365 days.

If we enter details here and save the module configuration then they will still be present when it is reopened. However, we still need to include them in the the default.php. To call them in this file we will use the $params object, which is available to all modules.
Edit the code as follows. After "try {" replace
{codecitation class="brush:php; gutter:false;" width="74.923em"}
// create an instance of the GoogleAnalytics class using your own Google {email} and {password}
$ga = new GoogleAnalytics({email},{password});
// set the Google Analytics profile you want to access - format is 'ga:123456';
$ga->setProfile({GA Profile ID});
// set the date range we want for the report - format is YYYY-MM-DD
$ga->setDateRange('2010-04-01','2010-04-07');
{/codecitation}
with
{codecitation class="brush:php; gutter:false;" width="74.923em"}
// create an instance of the GoogleAnalytics class using your own Google {email} and {password}
$ga = new GoogleAnalytics($params->get('email'),$params->get('password'));
// set the Google Analytics profile you want to access - format is 'ga:123456';
$ga->setProfile('ga:'.$params->get('profileid'));
//Get the daterange param. This value will either be 1,2 or 3
$daterange = $params->get('daterange');
if($daterange == 1) {
//Take 7 days off today's date and format as YYYY-MM-DD
$startdate = date('Y-m-d',time()-7*86400);
} else if ($daterange == 2) {
//Take 30 days off today's date and format as YYYY-MM-DD
$startdate = date('Y-m-d',time()-30*86400);
} else if ($daterange == 3) {
//Take 365 days off today's date and format as YYYY-MM-DD
$startdate = date('Y-m-d',time()-365*86400);
}
//Format today's date as YYYY-MM-DD
$enddate = date('Y-m-d',time());
// set the date range we want for the report - format is YYYY-MM-DD
$ga->setDateRange($startdate,$enddate);
{/codecitation}
When using $params->get('PARAMETER NAME'), the name is the same as the value we set in the xml file.
time() returns us the current time as a UNIX timestamp.
date() helps us format the time the correct way.
And that's it! You should now have a fully functional visitor map that works in the administrator section of your Joomla! website. To create an install package simply download the files into the same directory you started with on your local machine and zip the folder. Don't forget to download the lib folder with the google analytics class!
Here's what the final module looks like when the table is set to display only the top 3 countries:

I hope this tutorial has been of some use for those of you who are trying to get to grips with the design of custom Joomla extensions! Please feel free to leave any comments suggesting ways I could enhance or improve it.
The finished module installer file is available for download below.
